
You have two video quotes on your desk. One is $8,000. The other is $30,000. You can explain the difference in shoot days, crew size, and rounds of edits.
Then finance asks, “What do we get for it?” You can feel the meeting change. The quote you knew how to explain a minute ago is suddenly the least interesting thing on the table.
I get asked what a video costs all the time. I understand the impulse. A quote gives you a number you can take back to the office. The question I want to get to while we’re still talking is, “What are you hoping will be different after people see it?”
Say your team keeps losing deals after a good demo. That’s a frustrating place to lose one. The buyer has seen the work, the rep thinks it went well, and then the whole thing goes quiet. If you can find out what happens in that gap and what one additional sale would contribute, you have something to put next to the quote.
That’s what I mean when I ask, “Compared to what?”
To estimate B2B video ROI before you spend, pick one outcome the video can plausibly change. Work out how much that change could contribute to profit, then compare it with the full cost of making and using the video.
Give the video a job you can measure
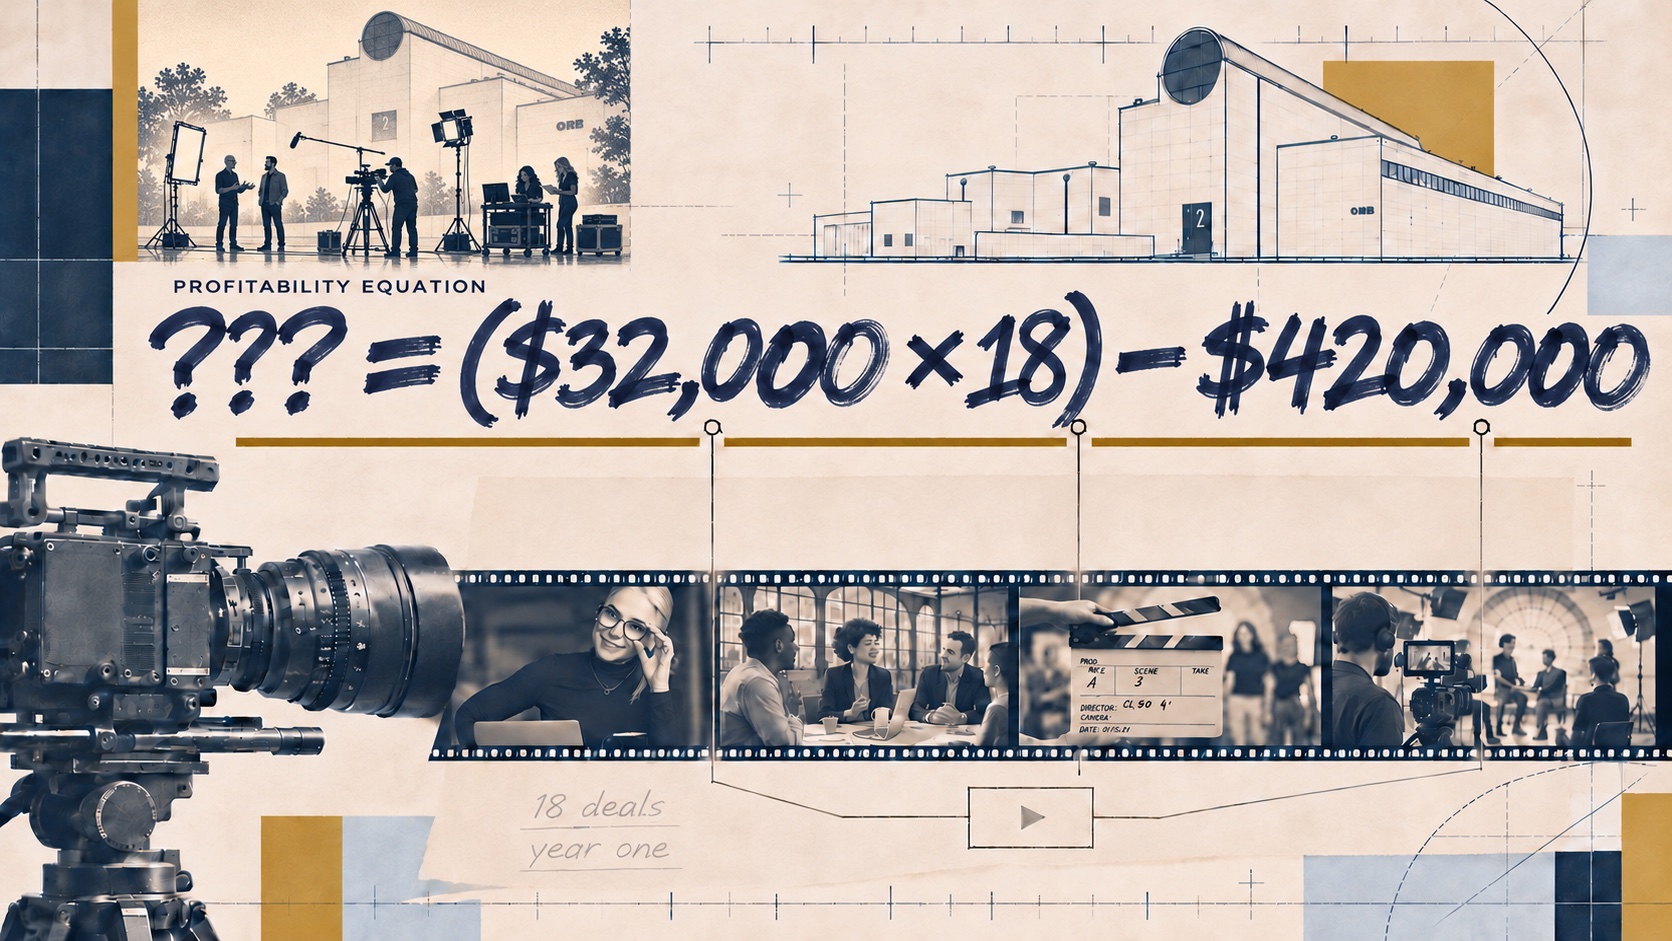
Strip the decision down far enough and you get familiar math. For a single offer at one price, revenue is price times volume. Subtract your costs and you have profit for the period.
Profit = (price × volume) − costs
A video can help you keep more of the price you quoted, win more business, or spend less time and money getting the work sold and delivered. Before you decide what to make, pick the change that would justify making it.
Then get specific about the person who has to do something differently. A buyer has to feel comfortable signing at the quoted price. A department head has to make the case to a buying committee. A new customer has to complete a setup step without calling your team. Once you can picture that moment, you have something to put in a brief.
The examples below use hypothetical numbers. Use your own when you run the math.
Price is where a buyer has to defend the difference
Picture a prospect who likes your team, likes the proposal, and asks one last question before signing. “Can you do any better on the number?”
Sometimes they have a hard budget. Sometimes procurement asks everyone for a discount. And sometimes the person who sat through your presentation has to go back to a boss who sees two similar proposals and one higher price.
That last problem is one a video can help with. Let a customer describe the risk they were taking and what happened after they signed. Or show what your team checks before a job goes out the door. Now your buyer has a detail they can bring into the room, even if you are not in the conversation.
Say your standard deal is $40,000 and your team routinely takes 10% off. If you cut that discount to 5% on 30 comparable deals, you keep another $60,000 in revenue. That only holds if you still win those deals at the same scope. Watch the win rate alongside the discount. It’s easy to celebrate firmer pricing while fewer customers sign.
Before you commission a case study, ask your sales team to pull a few deals where they gave up price. What did the buyer need to believe to sign at the original number? If the answer was “they needed another $4,000 in their budget,” you can save yourself a shoot.
Volume is where your contact has to sell without you
The demo goes well. Your contact asks for the deck and says they’ll share it with the team. Two weeks later, your rep is writing another version of “Just checking in.”
Think about what you handed that contact. They have a deck, a few notes, and whatever they remember from the call. Now someone in operations wants to know who’s going to handle the rollout. Your contact likes the idea. They may like it a little less when they realize they’re the one who’ll have to explain it if something goes wrong.
Give them something that makes that job easier. If the operations lead is worried about disruption, show how a rollout actually works. If the committee wants to know whether you’ve handled a project like theirs, let a customer walk through what happened. Make it easy for your contact to say, “Start here. This answers the question we had yesterday.”
Measure what happens at the stage you’re trying to improve. If you send 40 comparable proposals a year and win 20%, that’s eight deals. At 25%, it’s ten. Two extra deals at $40,000 bring in $80,000 in revenue. Before you put that number in the business case, work out what it costs to deliver those two deals.
If your goal is a shorter sales cycle, track that separately. Getting a signature in April instead of June can matter to cash flow and planning. Count additional sales only when the team can use the freed capacity and has enough demand to fill it.
Costs are where your team keeps answering the same question
Spend a morning with your sales or onboarding team and you’ll hear the same explanation come around again. By the third time, you may know it well enough to give it yourself. The person doing the explaining still has a full day of work ahead.
You’re looking for an explanation people can use on their own. It might be how to prepare for implementation, where to find a report, or what your team needs before work can start. These videos tend to be easy to brief because somebody on your team can give you the script over coffee. They’ve been saying it for two years.
Say a rep spends 30 minutes on the same walkthrough in ten calls a week. Over 50 working weeks, that’s 250 hours spent on the walkthrough. If a video trims 15 minutes from each call and people actually use it, you get 125 hours back.
What will your team do with those hours? If they cover more customer calls, you’ve created capacity. If you avoid overtime or reduce paid contractor hours, you can put a dollar figure on the expense you avoided. Either outcome can matter. Write down which one you’re counting on before you make the video.
How many extra deals would pay for the video
At a total project cost of $25,000 and $14,000 in contribution per additional sale, you need two extra deals to cover the investment.
Say your sales team wants a short series to help deals that go quiet after the demo. You budget $25,000 for production and rollout. Your average deal is $40,000. After the costs of winning and delivering an extra deal, you keep 35%, or $14,000, toward covering the project.
| Additional deals in year one | Contribution from those deals | After the $25,000 investment |
|---|---|---|
| 0 | $0 | −$25,000 |
| 1 | $14,000 | −$11,000 |
| 2 | $28,000 | $3,000 |
| 4 | $56,000 | $31,000 |
This is where I’d put the spreadsheet aside and ask sales to pull up a couple of deals. What did the buyer say after the demo? Who still had questions? Two extra deals looks modest on paper. It feels different when you’re looking for two real opportunities where better proof might have changed the conversation.
Give the $8,000 proposal the same treatment. If it can get the right proof into the right hands and the total cost really is $8,000, one additional deal covers it in this example. You might find you need one good customer story and a rep who knows when to send it.
Decide how you’ll know before you shoot
Write down who will use the video, when they’ll use it, and what you’ll look at afterward. If it’s for deals that stall after the demo, agree on what counts as a stall and track whether reps actually send the video. Give those opportunities enough time to move through a normal sales cycle.
When you can, test it with comparable opportunities and keep your usual follow-up for a comparison group. If you only have enough deals for a before-and-after comparison, look at what else changed. A new offer, different lead sources, or a change in the sales team can all affect the result. If sales tells you a buyer forwarded the video and came back with a more specific question, that’s useful evidence about how the asset helped. It takes more evidence to put the whole deal in the video’s column.
If you’re deciding what to track, I wrote about video KPIs tied to pipeline and sales at CRM Studios.
“We’ll put it on the website” can sound like a plan when everybody’s busy getting the thing made. Picture the week after it goes live. Who needs to find it? What do you want them to do after they watch? If nobody can tell you who’ll be looking for that change, you’ve got a question to settle before the shoot.
If you’re collecting quotes now, bring the Three Numbers to Know Before You Buy Video worksheet to your next conversation with sales or finance. Fill in what you know and circle what you’re guessing. I’d rather spend the first ten minutes of a production meeting talking about one of those circles than the next six months wondering what the video did.
Questions about B2B video ROI
How do you calculate B2B video ROI
Subtract the total video investment from the financial benefit attributable to the project. Divide the result by the investment and multiply by 100. For additional sales, use what’s left after the costs of winning and delivering those deals. Include production, distribution, and any other costs needed to put the video to work.
How many extra sales does a video need to pay for itself
Divide the total project cost by what one additional sale contributes after its incremental costs. Round up to the next whole deal. If the video costs $25,000 and one extra sale contributes $14,000, two additional sales cover the investment.
How can you tell whether a video helped close more deals
Track where the video was used and compare similar opportunities that received it with opportunities that received the usual follow-up. Give both groups a full sales cycle. If you only have before-and-after data, consider changes in pricing, lead quality, and sales activity before assigning credit to the video.
Break-even method reference U.S. Small Business Administration